
The Forex trading Puzzle
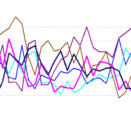
Forex Market behaviour can cause Sell and Buy signals at the same time and this can be confusing.
Online Forex traders using technical analysis are able to select any chart timeframe they would like to trade. The time frame is determined by the price movement being measured and displayed during the selected time frame. A five minute chart, for instance, means that the price movement of a currency is displayed as a bar, or candle or point every five minutes. The one hour chart would therefore reflect the price movements of sixty minutes in every bar or candle. Forex traders who scalp the market and like taking advantage of small movements in prices. They would therefore use one minute to fifteen minute charts. Swing trading long term Forex traders could use weekly and daily charts.
Often Forex traders using charts with different timeframes face a trading dilemma. The trend can be up in one timeframe and down in another timeframe causing some confusion. This is especially tricky for beginners. It is conceivable that you can get strong buy signals in one time frame and a very strong sell signal in another. These inconsistent readings are often cited as one of the biggest weaknesses of using technical analysis in trading Forex market behaviour.
Forex trading Solution
Experienced and skilled Forex traders have however found that they can use this strange market behaviour to their advantage. One of the most respected proponents of technical analysis is Dr Alexander Elder. He has for years promoted a three time frame technique which has become a standard way of trading for many traders.
One would use three charts with three different timeframes. Generally the timeframes will have gaps of six to three. This fit well into the natural way chart are presented. Starting with the one minute chart and moving on: There are five one minute readings in a five minute chart. Three five minute readings in a fifteen minute chart. Four fifteen minute readings in one hour chart. Four one hour readings in a four hour chart. Six four hour readings in a daily chart and there are five daily readings in the weekly chart and finally there are four weekly readings in the monthly charts. One would then simply select any three charts that follow the above sequence as your trading charts.
Overnight swing traders will often select the weekly, daily and four hours from the above sequence. You can then use the longer term charts to establish the general direction of the trend. Once the trend is established you would only trade in the direction of the trend using the next chart to identify the trading opportunity. Once a trading opportunity is established the Forex trader would then use the shortest time frame to enter the trade at the most opportune time.
3 Forex chart method
The beauty of this method is that it can be adapted to any trader’s need. The scalping traders can use the fifteen minute, five minute and one minute charts in exactly the same way.
This three time frame Forex trading method can even be extended to more advanced applications. There are many groups of currencies that are natural hedges. You can use transactions in the EURUSD and USDJPY to hedge against movements in the EURJPY for instance. Some advanced Forex trading techniques use the three time frame technique on all three related currencies to pinpoint even stronger trading signals.
The Forex Market Behaviour technique in its basic form will add enough value to any Forex traders results without going to the more advanced methods
Free Forex Momentum Indicator provides the best Forex entries
 Making Money from Forex Chaos using a free Indicator
The Amazing Momentum Spaghetti Indicator
Enter the market [more]
Making Money from Forex Chaos using a free Indicator
The Amazing Momentum Spaghetti Indicator
Enter the market [more]
Video based Channel trading Course
 The current version of the video channel course is available below.
Please review it and add [more]
The current version of the video channel course is available below.
Please review it and add [more]
12 ways how to Manage your Open Forex Trade strategies
 Open Forex trade strategies
When a Forex trade in opened many traders just wait for the [more]
Open Forex trade strategies
When a Forex trade in opened many traders just wait for the [more]
Successful Forex Decisions. Price halfway to trading target.
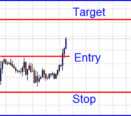 .
What are you going to do ?
Trading challenge
Below is a typical Forex trading dilemma. You [more]
.
What are you going to do ?
Trading challenge
Below is a typical Forex trading dilemma. You [more]
Forex MT4 Hedged EA works using any currency, time frame, settings
 .
EMail sent 18 April 2017
New Hedging EA created
Hi
The RSI Trendline TRADER
A big thank you to [more]
.
EMail sent 18 April 2017
New Hedging EA created
Hi
The RSI Trendline TRADER
A big thank you to [more]
Forex Indicators and Forex Trading Tools available from US suppliers
 .
[ebayfeedsforwordpress feed="http://rest.ebay.com/epn/v1/find/item.rss?keyword=%28Forex+indicator%2CMt4+Indicator%2CForex+Mt4+Indicator%2CAutomatic+Forex+Indicator%29&categoryId1=158906&sortOrder=PricePlusShippingHighest&programid=1&campaignid=5338068546&toolid=10039&listingType1=All&lgeo=1&descriptionSearch=true&feedType=rss" [more]
.
[ebayfeedsforwordpress feed="http://rest.ebay.com/epn/v1/find/item.rss?keyword=%28Forex+indicator%2CMt4+Indicator%2CForex+Mt4+Indicator%2CAutomatic+Forex+Indicator%29&categoryId1=158906&sortOrder=PricePlusShippingHighest&programid=1&campaignid=5338068546&toolid=10039&listingType1=All&lgeo=1&descriptionSearch=true&feedType=rss" [more]
Forex Indicators and Trading Tools available from UK suppliers
 [ebayfeedsforwordpress feed="http://rest.ebay.com/epn/v1/find/item.rss?keyword=%28Forex+indicator%2CMt4+Indicator%2CAutomatic+Forex+Indicator%2CForex+Mt4+Indicator%29&categoryId1=158906&sortOrder=PricePlusShippingHighest&programid=15&campaignid=5338068933&toolid=10039&listingType1=All&lgeo=1&descriptionSearch=true&feedType=rss" [more]
Expert Advisors and Forex Trading Tools available from UK suppliers
[ebayfeedsforwordpress feed="http://rest.ebay.com/epn/v1/find/item.rss?
keyword=%28Forex+EA%2CAutomated+Forex%2CForex+expert+advisors%2CMT4+EA%2CMt4+Expert+Advisor%29&categoryId1=158906&sortOrder=PricePlusShippingHighest&programid=15&campaignid=5338068933&toolid=10039&listingType1=All&lgeo=1&descriptionSearch=true&feedType=rss" [more]
Expert Advisors and Forex Trading Tools available from US suppliers
.
[ebayfeedsforwordpress feed="http://rest.ebay.com/epn/v1/find/item.rss?keyword=%28Expert+Advisors%2CMT4+EA%2CMT4+Expert+Advisor%2CForex+robots%2CAutomated+Forex%29&categoryId1=158906&sortOrder=PricePlusShippingHighest&programid=1&campaignid=5338068546&toolid=10039&listingType1=All&lgeo=1&descriptionSearch=true&feedType=rss" [more]
Succeed in the random Forex market's clusters of bad and good luck
 Why Trading Forex is so Difficult?
Randomness in the Markets.
Clusters of Bad and Good Luck.
David Paul, [more]
Why Trading Forex is so Difficult?
Randomness in the Markets.
Clusters of Bad and Good Luck.
David Paul, [more]
Your April-June issue of FX Trader Magazine is available
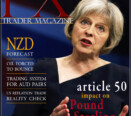 Your April-June issue of FX Trader Magazine is available
Apr-Jun edition
In this edition:
ARTICLE 50
Its impact [more]
Your April-June issue of FX Trader Magazine is available
Apr-Jun edition
In this edition:
ARTICLE 50
Its impact [more]
The 3 Trailing stop Forex trading system and risk management technique.
 Recently we introduced a 3 Trailing stop system into one of our Expert Advisors. It [more]
Urgent. Competent Pre-release Forex MT4 EA Testers required
 Recent email sent out to clients - 7 April 2017
Hi
We need highly competent EA testers [more]
Recent email sent out to clients - 7 April 2017
Hi
We need highly competent EA testers [more]
Achieve a 1 percent Forex Drawdown all your EA trading and Forex techniques
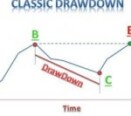 Many Forex Traders regard drawdowns as an important statistic when trading or testing an Expert [more]
Your free Official Trading Magazine for Download April 17
 Click here to download:
DOWNLOAD [more]
Click here to download:
DOWNLOAD [more]
Leave A Response
You must be logged in to post a comment.